Near a GHGRP submission deadline, environmental teams at industrial operators often discover the same problem: the inventory is "done," but the supporting calculations live in spreadsheets, consultant models, and shared drives that are difficult to audit or reconcile.
That is the gap emissions management software is meant to close. The job is not another dashboard. It is a governed way to connect production data, equipment inventories, field measurements, emissions factors, and enterprise systems so reporting is the output of a process, not a year-end scramble.
Not all platforms solve the same problem. Some are built for corporate carbon disclosure. Others are built for the facility-level work that produces the numbers disclosure depends on. Buyers searching for air emissions management software are usually describing that facility-level work: criteria pollutants and GHGs tied to sources, permits, and operating data, not only a corporate carbon total.
This guide explains how emissions management software works, which capabilities matter for industrial operations, and how to evaluate platforms against your actual emissions program. How that work differs from carbon accounting as a job is in carbon accounting vs emissions management. For a broader environmental compliance buy that sits beside emissions, use How to Choose Environmental Compliance Software.
Emissions management software at a glance
What it is: Software that helps manage the emissions lifecycle, from source data and calculations through validation, reporting, forecasting, investigation, and response.
Who needs it: Organizations managing complex facilities, multi-site operations, regulatory reporting programs, measurement data, or emissions reduction planning connected to operational and capital decisions.
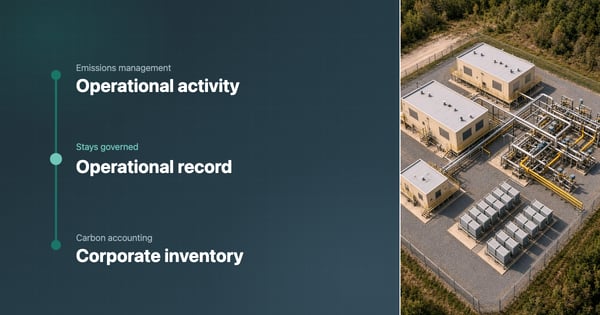
Key distinction: Carbon accounting software typically focuses on assembling and reporting corporate GHG inventories. Industrial emissions management software often extends into the facility-level data, calculations, regulatory requirements, and workflows behind those totals.
How to evaluate it: Match the type of platform to your primary use case, then test shortlisted vendors with realistic data and exception scenarios. Don’t score the dashboard; score the exception path.
Download: Emissions Software Evaluation Checklist →: use-case definition, demo script, and scoring matrix from this guide.
What is emissions management software?
Emissions management software helps organizations collect emissions-related data, quantify results, validate them against rules and expectations, meet reporting requirements, forecast future performance, and coordinate reduction work. In industrial settings, the same category is often called air emissions management software when the priority is facility or source-level air and GHG calculations, evidence, and filings rather than enterprise disclosure alone.
Capabilities vary more than most vendor websites suggest. One platform might excel at Scope 1, 2, and 3 corporate inventories for voluntary or mandatory disclosure. Another might be built for hundreds of tanks, compressors, and flares, each with its own calculation method, permit condition, and data owner. Buyers who skip that distinction often end up with software that reports well and calculates poorly, or the reverse.
A strong industrial platform may support source-level air and GHG calculations; integrations with operations, historians, ERP, and monitoring systems; emissions factor and methodology management with version history; validation, QA/QC, and exception routing; regulatory and voluntary reporting from governed data; measurement intake, investigation, and response; forecasting tied to assets; and audit trails with role-based access. Corporate Scope accounting may also be in scope, but it should not be the only proof of depth.
The EPA Greenhouse Gas Reporting Program requires annual reporting from thousands of US facilities and suppliers. For industrial operators, the annual report is often the smallest part of the workload. The larger job is keeping source data current, applying the right methodology when rules change, reviewing exceptions, responding to new measurements, and feeding credible numbers into planning.
Which type of emissions management software do you need?
Start with the work, not the vendor shortlist. Match the primary challenge to the platform type you should evaluate, then look at vendor names.
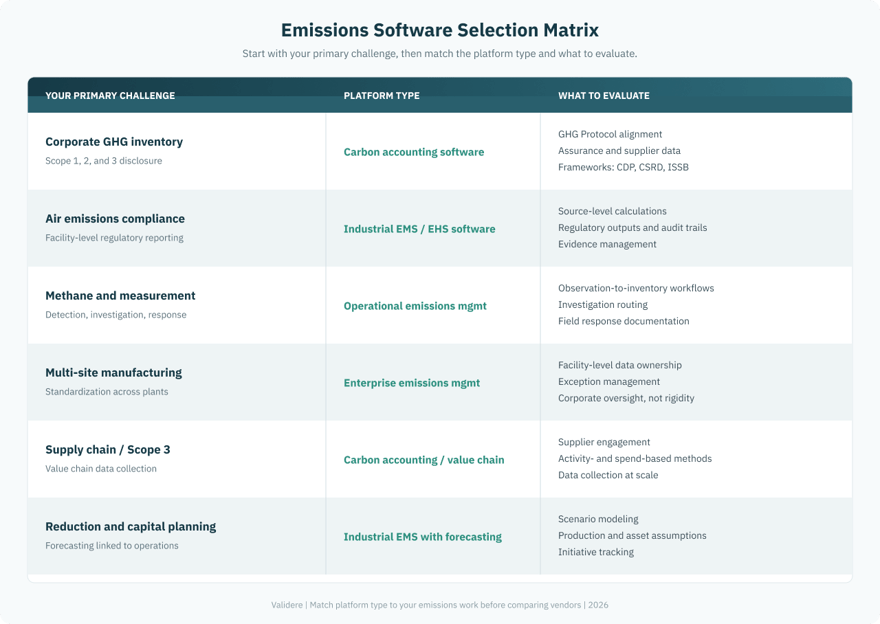
Figure 1: Emissions software selection matrix. Start with your primary challenge to determine which platform type to evaluate.
| If your primary challenge is... | Look for software strong in... |
| Corporate GHG inventory | Scope 1, Scope 2, and Scope 3 accounting and disclosure |
| Air emissions compliance | Facility-level calculations, regulatory reporting, and evidence management |
| Methane and measurement programs | Detection integration, investigation, response, and documentation |
| Complex industrial emissions | Source-system integration, asset hierarchies, QA/QC, calculations, and workflows |
| Reduction and capital planning | Forecasting, scenario modeling, and initiative evaluation |
| Multi-site environmental management | Standardized methodologies, facility permissions, exception management, and corporate oversight |
These categories overlap. An upstream operator may need a single Scope 1 total for sustainability, while producing it still requires production accounting, equipment inventories, engineering calculations, methane measurements, field investigations, and state air reports in the same program year.
The better starting question is not which platform has the most features, but what emissions work the organization runs weekly, monthly, and at year-end. If that work is facility calculations, filings, measurement follow-up, and forecasts, a disclosure tool will leave most of it sitting beside the inventory. Industrial emissions management software is built to keep those jobs on the same governed data the annual report comes from.
How does emissions management software work?
Mature programs run a connected lifecycle, not a set of disconnected modules adopted at different times. The software has to move work from source data through calculation, review, reporting, forecasting, and response without dropping the trail between stages.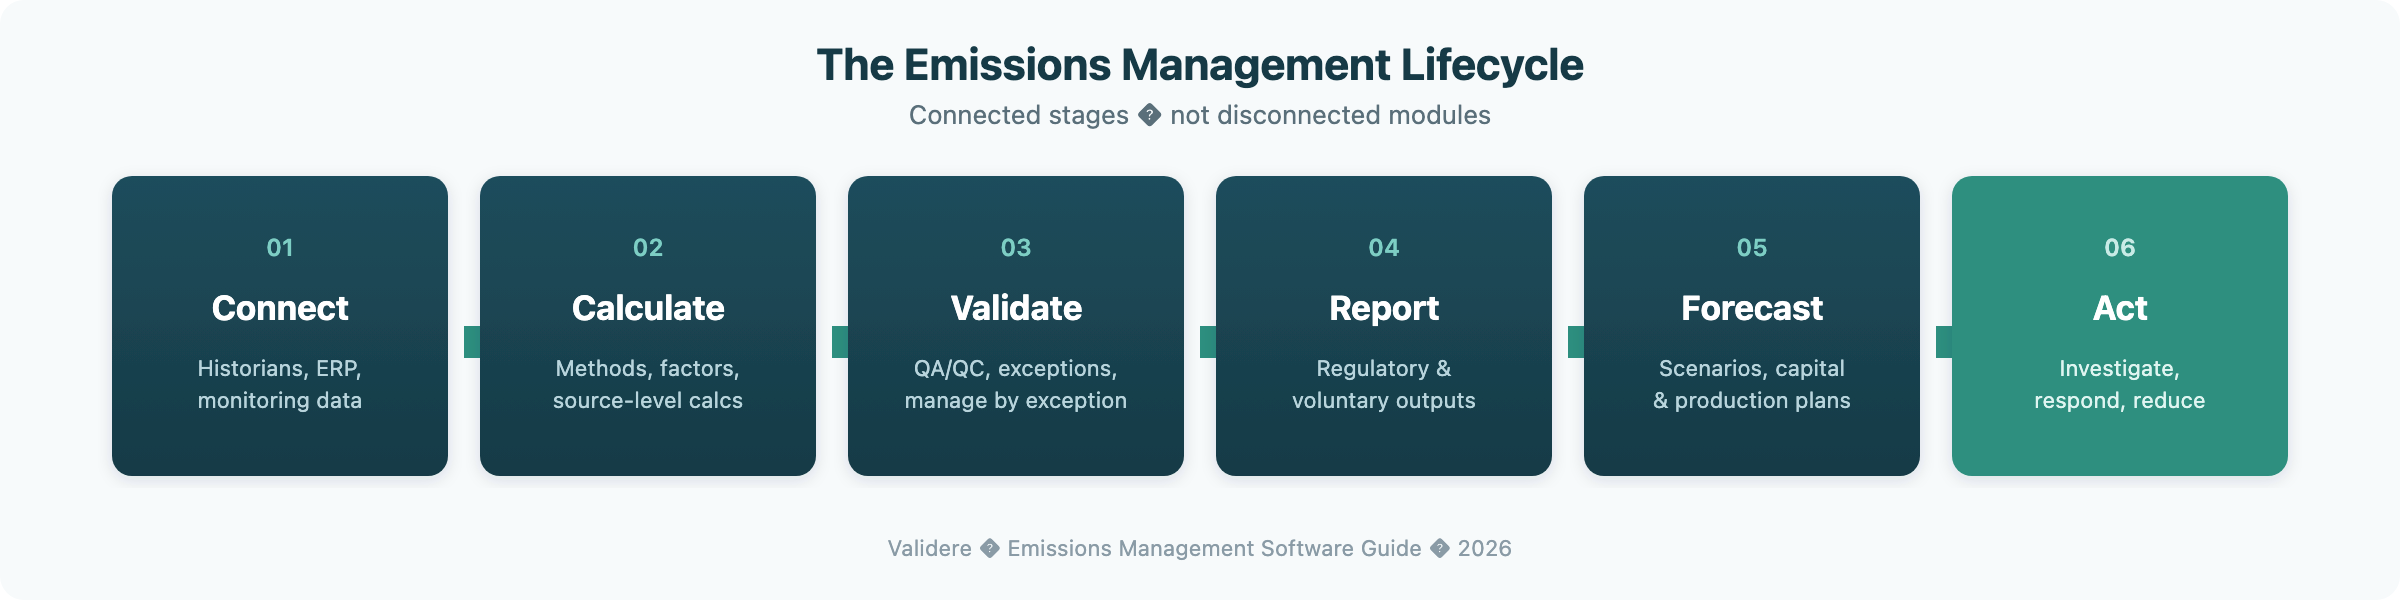
Figure 2: The emissions management lifecycle. Platform strength depends on how effectively work moves between stages.
Compare by platform type, not category labels alone
| If your priority is... | Platform type to evaluate | What to evaluate closely |
| Corporate disclosure and Scope 3 | Carbon accounting software | GHG accounting methodology, assurance readiness, supplier data, and disclosure framework coverage |
| Facility air compliance and GHG | Industrial emissions or EHS software | Source-level calculations, regulatory outputs, audit trails, and evidence management |
| Methane measurement and response | Operational emissions management | Observation-to-investigation workflows, response routing, and documentation |
| Supply chain and Scope 3 | Carbon accounting or value-chain tools | Supplier engagement, activity and spend-based methods, and data collection at scale |
| Fleet or sector-specific emissions | Sector-specific or configurable emissions software | Sector data models, relevant calculations, and regulatory alignment |
Connect emissions data
Relevant data often comes from production accounting, SCADA and historians, ERP platforms, EHS software, continuous emissions monitoring, methane detection technologies, lab results, equipment inventories, utility bills, and spreadsheets maintained outside any central system.
A relatively simple corporate inventory may only require utility and fuel imports. A distributed industrial operator may manage thousands of sources across dozens of systems. Software should be evaluated on whether it preserves facility and asset hierarchy when source data changes, not only on whether it accepts file uploads.
Integration projects often look straightforward in initial demos and become complex when asset naming, unit conventions, or update frequencies do not match the emissions data model. Testing with real source system samples early reduces that risk.
Practitioner insight: The difficult part of emissions management is often not calculating a single emissions value. The larger challenge is maintaining reliable source data, ownership, methodologies, and review processes as assets, systems, and requirements change.
Calculate and quantify emissions
Calculations range from fuel consumption multiplied by an emissions factor to source-specific methods, measured-versus-estimated splits, jurisdiction-specific rules, and methodology changes that must not silently rewrite historical results.
The EPA's GHG Emission Factors Hub and AP-42 Compilation of Air Emissions Factors illustrate how wide the methodology surface area can be across sectors and source types.
An emissions result should not appear only as a final value in a dashboard. Users should be able to trace the source data, methodology, assumptions, and transformations behind it.
Evaluation red flag: A reported total with no clear path back to activity data, factors, methodology, and calculation version.
Validate emissions data
Validation helps teams manage by exception. Rules can catch missing records, unit errors, duplicate entries, and values that shift materially period-over-period before they reach a submission-ready report. Without structured validation, these checks often become a manual pre-deadline exercise repeated every reporting cycle.
Common evaluation mistake: Buyers often review dashboards and final reports before testing exception workflows.
Evaluation red flag: Validation only happens after the data has been exported back into spreadsheets.
Report emissions
One governed dataset may need to support GHGRP submissions, state air reports, voluntary programs, internal performance reviews, and assurance processes, each with different aggregation rules and review requirements. Weakness anywhere in that chain shows up when reviewers, auditors, or regulators ask why a value changed.
For reporting year 2023, EPA received direct emissions from 7,544 US facilities across nine industry sectors under GHGRP, as shown in the EPA GHGRP reported data. Software should support the organization's reporting environment rather than forcing every program into one rigid template. For reporting-specific evaluation, see emissions reporting software. What those reviews establish is covered in emissions assurance and verification in oil and gas.
Forecast future emissions
Historical reporting answers what happened. Forecasting answers what could happen next, based on production assumptions, facility changes, capital projects, and planned reduction initiatives. Forecasting belongs in platform evaluation when emissions information influences capital, production, or compliance planning, not only annual disclosure. Depth on that job lives in emissions forecasting in oil and gas and Validere’s forecasting and scenario modeling.
Act on emissions information
Measurement without response adds noise to an inventory. Methane programs, in particular, require workflows that connect observations to assets, investigations, field response, documentation, and inventory updates where appropriate.
A typical response path includes receiving an observation, associating it with the right asset, assessing significance, investigating the likely source, assigning response work, documenting the outcome, and updating the emissions record when warranted. Software does not perform field work. It helps teams prioritize response and track whether actions had the intended effect. That workflow sits beside LDAR software and emissions measurement and response, not in a separate inventory tool.
10 capabilities to evaluate in emissions management software
Feature lists on vendor websites look similar. Behavior under your constraints is what matters. Three areas deserve particularly deep evaluation: data integration, configurable calculations, and QA/QC. Score the rest against the pitfalls that show up after go-live. Broader environmental compliance evaluation belongs in How to Choose Environmental Compliance Software.
1. Data integration
Emissions data can live across production systems, historians, ERP platforms, EHS software, monitoring technologies, data warehouses, spreadsheets, and field applications. The important question is not whether a vendor advertises integrations. It is whether the platform can connect to the systems your teams use, preserve asset and facility relationships, and maintain traceability when a source record changes. An integrations marketing page is not architecture proof.
2. Configurable emissions calculations
Industrial emissions calculations vary by source, facility, jurisdiction, methodology, and reporting program. The platform should support methodology edits, version history, and drill-down to factors without making every change depend on custom development.
3. Data validation and QA/QC
The platform should help identify incomplete, inconsistent, duplicate, or anomalous information before it becomes a reporting issue. Strong QA/QC capabilities help teams manage by exception rather than manually reviewing every value. Ask what happens when data is missing, duplicated, or materially different from the previous period.
4. Facility and asset-level visibility
Corporate rollups without drill-down to source data limit investigation and audit response. A reviewer who cannot move from a facility total to the tank, compressor, or activity record will reconstruct that path in email when EPA or an assurer asks.
5. Regulatory and voluntary reporting
Separate silos per program often recreate duplicate entry and reconciliation work. One governed dataset should support GHGRP, state air, and voluntary views without rebuilding the inventory for each output. Industrial operators with EPA GHGRP obligations should prioritize audit lineage and regulatory configurability over generic marketplace ratings. For program orientation, see the EPA GHGRP reporting guide and the EPA Subpart W reporting guide.
6. Audit trails and calculation transparency
Reviewers should trace a reported value to source data, methodology, and approvals inside the system. An activity log that shows a user changed a value is weaker than a process that shows origin, transformation, methodology, supporting evidence, and approvals. If the trail lives in a shared drive, the software is recording the answer rather than the work.
7. Workflow automation and exception management
Approvals and investigations should not depend entirely on email and offline trackers. Assigned owners, due dates, and escalation are part of emissions management, not a project-management add-on.
8. Measurement and field response
Measurement data should connect to investigation and documentation workflows, not sit in a standalone list. An aerial flag that never reaches the inventory or the repair record is noise.
9. Forecasting and scenario modeling
Scenarios should reflect operational and capital assumptions relevant to your assets. A corporate reduction target with no tie to production, retirements, or funded projects is a slide, not a forecast.
10. Governance, permissions, and enterprise security
Facility users should access their assets and responsibilities without exposing unrelated data across the organization. Multi-site programs fail when every plant sees every record, or when corporate cannot see exceptions at all.
Who uses emissions management software?
Requirements increase with the number of facilities, sources, reporting programs, and underlying systems. A single plant with stable methods can often run on spreadsheets; a multi-site operator with GHGRP, state air, and measurement programs usually cannot.
Oil and gas
Upstream and midstream programs often combine combustion, venting and flaring, fugitive emissions, pneumatics, tanks, compressors, engines, LDAR, and multiple measurement methods in the same operating area. The hard part is keeping source data, calculations, investigations, and regulatory outputs on one governed trail when methods and owners differ by asset.
Utilities
Environmental teams at utilities manage fuel and operational data, permit-level calculations, portfolio changes, and multi-year forecasts across generation, transmission, and distribution. Historical dashboards show where the program has been; scenario tools help compare retirement timing, new capacity, and production assumptions.
Refineries and petrochemical facilities
A single refinery or petrochemical site may contain hundreds of sources with different monitoring requirements, calculation methods, permit conditions, and reporting obligations. Investigating a material year-over-year variance should not require reconstructing the trail across disconnected tools.
Manufacturing and other asset-intensive industries
Large manufacturers often need common methodologies and corporate visibility into exceptions, without forcing every plant into an identical operating model. For Scope 1 work, confirm combustion, process, and purchased energy are supported at the detail both GHG and air programs require, not only at an enterprise rollup.
Emissions management software vs. carbon accounting software
Carbon accounting and emissions management overlap, but they often start from different jobs. Carbon accounting typically focuses on assembling and governing a corporate GHG inventory for Scope 1, Scope 2, Scope 3, disclosure, target tracking, and assurance. Industrial emissions management works closer to facilities and physical sources, where operational data, calculations, measurements, regulatory requirements, investigations, and reporting workflows produce the emissions information behind those totals.
Some organizations need one. Complex industrial operators may need both.
|
Carbon accounting |
Industrial emissions management |
|
|---|---|---|
|
Primary job |
Corporate GHG inventory and disclosure |
Facility and source emissions operations |
|
Typical level |
Enterprise / Scope |
Facility / asset / source |
|
Scope 3 |
Often central |
Varies |
|
Air regulatory work |
Varies |
Often central |
|
Measurement response |
Usually not core |
Can be central |
Decision shortcut: If the primary need is corporate inventory assembly and disclosure, start with carbon accounting software. If the primary need is ongoing environmental operations with facility accountability, evaluate industrial emissions management software.
Read the full comparison: Carbon Accounting vs Emissions Management.
Where emissions management software implementations fail
Most implementation problems stem from fit and execution, not from whether software was purchased in the first place. The failures below show up after go-live, when the demo data is gone and the real reporting calendar is not.
1. Choosing disclosure software for operational work.
Platforms built primarily for corporate carbon reporting may not support source-level methodology control, regulatory air outputs, or facility workflows. Match platform type to the primary job.
2. Demonstrating the platform on overly clean data.
Pilot datasets that do not reflect real naming conventions, gaps, or system latency hide integration risk. Use at least one facility, one operational data source, and one real reporting form in evaluation.
3. Failing to define data ownership.
Without defined owners for source data, methodology updates, and review steps, teams revert to parallel spreadsheets. Define responsibilities before configuration begins.
4. Accepting calculation rigidity.
If routine methodology changes require lengthy custom development, maintenance cost rises every year. Test edits and version history during evaluation, not after contract signature.
5. Treating report submission as the finish line.
Report generation is one milestone. Exception management, measurement response, and forecasting workflows should be in scope for early rollout phases when they matter to the program.
6. Underinvesting in change management.
Facility staff adopt systems that reflect how they actually review and approve data. Include plant environmental leads in workflow design early.
When spreadsheets are still defensible
Spreadsheets remain appropriate when source count is low, methodologies are stable, the team is small, and regulatory exposure is limited. Software investment typically pays off when multiple facilities, systems, reporting programs, or reviewers make version control, audit trails, and reconciliation risk greater than the convenience of spreadsheets.
How to choose the right emissions management software
Before comparing vendors, answer seven questions.
Download the evaluation checklist →: printable worksheet with these questions, a demo script, and a scoring matrix.
1. Which emissions programs must the platform support?
Consider corporate GHG inventories, Scope 1 and Scope 2, Scope 3, federal and regional regulatory reporting, methane programs, voluntary initiatives, reduction projects, and forecasting. A platform designed primarily for one use case may not be the best fit for another.
2. At what level of granularity must emissions be managed?
Determine whether the organization primarily needs corporate-level totals or information at the level of business units, facilities, assets, equipment, emissions sources, or individual measurements and events. Required granularity has significant implications for platform architecture.
3. Where does the source data live today?
Map source systems, manual spreadsheets, data owners, update frequencies, existing integrations, and known quality issues. A vendor demonstration using perfect sample data can hide one of the hardest parts of implementation.
4. How often do methodologies and requirements change?
Organizations add or retire facilities, change calculation methods, update factors, enter new jurisdictions, or adopt new measurement technologies. If every modification requires extensive custom development, the system may become difficult to maintain.
5. Which review, approval, and investigation workflows must be supported?
Map who provides data, who reviews it, who investigates exceptions, who approves calculations, who prepares reports, and who needs access to supporting evidence. The platform should support that operating model rather than forcing important steps into email and spreadsheets.
6. Do production or capital decisions require emissions forecasting?
If emissions information influences capital planning, production decisions, or reduction strategies, historical reporting may not be enough. The question is not whether the software has a forecasting chart, but whether the forecast can reflect changes in production, assets, operations, timing, and planned initiatives.
7. How should the platform fit the existing technology environment?
Consider how the software will work with ERP systems, EHS platforms, production systems, monitoring technologies, historians, data warehouses, and analytics tools. For many industrial organizations, replacing every existing system is neither practical nor desirable.
Industrial buyer takeaway: If emissions reporting depends on operational data, field activity, measurement results, and facility-level calculations, evaluate the full workflow. The final report is only as reliable as the data, calculations, reviews, and actions behind it.
Use the nine evaluation criteria for oil and gas emissions software when you are ready to score vendors against that workflow.
How to test vendors before you buy
Ratings and analyst reports can help you build a shortlist. They do not replace a demonstration with your own data. Don’t score the dashboard; score the exception path.
Ask every shortlisted vendor to walk through, in this order:
- A missing production or activity record
- A methodology or emissions factor change mid-year
- A measurement event that requires investigation
|
Capability |
What good looks like in practice |
|---|---|
|
Data integration |
Governed connection or import from operational systems with asset hierarchy preserved |
|
Calculations |
Methodology changes, version history, and drill-down to factors and source data |
|
QA/QC |
A clear exception-management process, not only a dashboard showing final values |
|
Reporting |
Governed data supporting multiple outputs without repeated manual entry |
|
Facility visibility |
Ability to move quickly from a facility total to the underlying source and activity data |
|
Forecasting |
Scenarios connected to production, asset changes, retirements, and capital projects |
|
Workflows |
Assigned investigations with ownership, status, evidence, and escalation |
Request demos using your asset structure and a real reporting form. If the product only looks strong after the data has been cleaned outside the system, you are evaluating a report viewer, not emissions management software.
How AI fits emissions management software
AI can help environmental teams interpret information that does not follow a fixed rule: surfacing unusual values, investigating potential drivers, mapping inconsistent source data, retrieving relevant evidence, and assisting with analysis.
Deterministic calculations, regulatory logic, and repeatable validation rules should remain automated rather than delegated to probabilistic models. Human review remains necessary where judgment or formal approval is required.
The important buying question is not whether a platform is "AI-powered," but where AI is used, what governed data it can access, and what remains deterministic or subject to human approval. For where AI helps environmental workflows and where rules-based automation is the better fit, see AI for environmental compliance.
How Validere fits
Validere is designed for industrial emissions work that starts below the corporate rollup. It connects operational data, facility and source-level calculations, QA/QC, regulatory reporting, measurement response, and forecasting while working alongside existing ERP, EHS, production, historian, and monitoring systems.
That makes it most relevant when the problem is not simply producing a corporate emissions total, but governing the data, calculations, exceptions, decisions, and evidence behind it.
Validere is not a generic carbon accounting suite, a simple dashboard, a replacement for every existing enterprise system, or an autonomous compliance platform. How carbon accounting and emissions management differ as jobs is in carbon accounting vs emissions management.
Explore emissions management software, emissions measurement and response, regulatory air and GHG reporting, and forecasting and scenario modeling, or request a demo.
Frequently asked questions about emissions management software
What is emissions management software?
Emissions management software helps organizations collect, calculate, validate, analyze, report, forecast, and act on emissions data. In industrial settings, the strongest value usually comes from connecting facility and source calculations, QA/QC, reporting, and evidence so teams are not reconstructing the inventory at filing time. Platforms vary widely; evaluate against your operations rather than category labels alone.
What is air emissions management software?
Air emissions management software is the industrial framing of the same category, focused on facility- and source-level air pollutant and GHG work: calculations tied to equipment and activity data, regulatory and permit support, QA/QC, and audit-ready evidence. The buying decision usually starts with whether the platform can run the plant’s air and GHG workflows, not only produce a corporate Scope total.
What is the difference between emissions management software and carbon accounting software?
Carbon accounting software generally focuses on corporate Scope 1, Scope 2, and Scope 3 inventories for disclosure. Industrial emissions management software often adds facility- and source-level calculations, air regulatory reporting, and operational workflows. Many organizations need capabilities from one category or both. The fuller jobs comparison is in carbon accounting vs emissions management.
How does emissions management software support regulatory compliance in the United States?
It helps govern the process from source data through calculation, review, and submission-ready outputs for programs such as the EPA Greenhouse Gas Reporting Program and state air reporting. Methodology history and evidence should stay attached so reviewers and auditors can follow a value without reconstructing it from email.
What should industrial companies look for in emissions management software?
Start with the work: source-system integration, configurable and versioned calculations, exception-based QA/QC, facility and asset visibility, multi-program reporting from governed data, reconstructable audit trails, measurement-to-investigation workflows, and forecasting tied to operational assumptions. Then test the exception path, not only the polished report.
When are spreadsheets still enough for emissions management?
Spreadsheets remain appropriate when source count is low, methodologies are stable, the team is small, and regulatory exposure is limited. Once multiple facilities, systems, reporting programs, or reviewers make version control and reconciliation the real workload, spreadsheet convenience usually costs more than software. When that line is the real question, see when spreadsheets stop working for emissions management.