.png)
With emissions reductions now a strategically important issue to oil and gas operators, these companies are devoting increasing time and capital to reducing their emissions. A decade ago, many operators’ emissions reporting was relatively siloed. Emissions teams focused on ensuring they had an up-to-date equipment inventory to ensure regulatory compliance, such as with Subpart W of the Environmental Protection Agency’s Greenhouse Gas Reporting Program.
Now, though, external studies highlight discrepancies between these inventory-based emissions estimates and aerial measurements, creating investor and public pressure for operators to improve their understanding of emissions to enable continued reduction. To do this, operators are increasingly pursuing many alternative measurements from a combination of fixed monitors, aerial flyovers, drones, and other sources. However, each of these technology deployments features its own methodology for emissions estimation, and often operators are left with data of differing types — an image from one source, a point-in-time estimate from another, an continuous measurement from a third — and no good way to combine them into a consolidated view of the truth or an actionable emissions-reduction plan.
Ingesting operational data — which also offers operators insight into their emissions — adds complexity to the problem, and may outgrow an operator’s internal solution that originally focused on regulatory compliance. Excel is perhaps the most transformative business software ever, and a universal and highly versatile tool for analytics across industries and roles — especially for projects in the proof-of-concept stage. But complex workflows eventually outgrow any spreadsheet solutions. Just as Salesforce replaced spreadsheets living on each account manager’s desktop, so too are other workflows moving on from spreadsheets to the next phase of their lifecycle.
Relying on piecemeal, do-it-yourself solutions for emissions data can lead to many issues, especially as the number of documents and teams who use them grow. The possibilities for manual data errors, miscommunication, and poor version control can cause costly problems that are, ultimately, avoidable. Each company’s assets and emissions monitoring solutions are unique, but common problems are nonetheless emerging across the industry. These common themes enable the development of scalable and repeatable measurement, reporting, and verification (MRV) software that can then be tailored to an operator’s asset base and equipment mix.
Explore some of the major pitfalls of using do-it-yourself solutions for operations and emissions data, and how to eliminate these risks with software and expert guidance.
Issues for teams still using Excel spreadsheets for GHG emissions.
There are several common errors and issues that can occur when organizations in the oil and gas industry rely on do-it-yourself solutions to keep track of important data. These include:
Ingest, track, and manage data sources
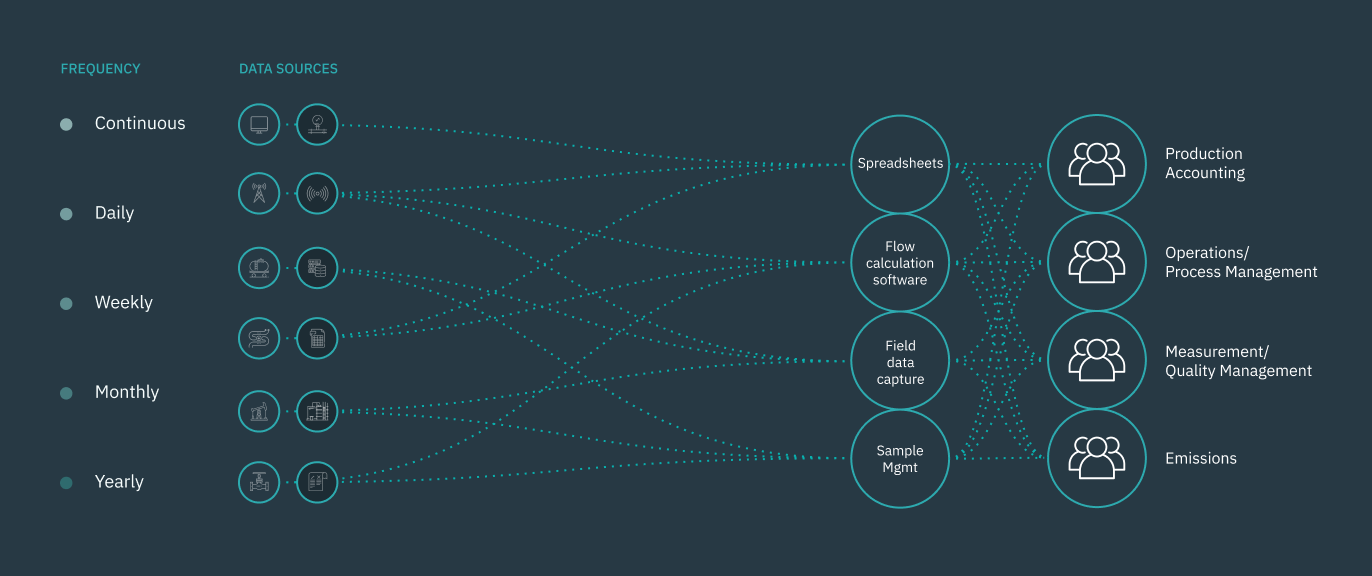
Emissions teams must contend with a unique set of issues. Collecting and validating key emissions data, for example, is unfortunately often a manual process requiring teams to juggle multiple tools, systems, and spreadsheets. This manual entry introduces the potential for error, such as when an operator receives an image and instantaneous emissions estimate from an aerial flyover.
Emissions teams need to prepare and validate data coming from disparate sources — an instantaneous emissions estimate from an aerial flyover, tank pressures from the company’s SCADA system, continuous emissions estimates from a fixed monitor, among others — in order to both meet regulatory reporting requirements and develop an internal view of measurement-informed emissions. Errors in transcription or translation can create costly mistakes. Getting all the right information together and ensuring its accuracy can be a painstakingly long process when there are no systems in place to centralize and verify emissions data.
Do-it-yourself solutions tend to result in data being siloed, with different teams using and interpreting the information in different ways. Slow or limited updates and the lack of centralization often lead to misalignment between teams on what findings mean and what steps to take next. When organizations lack a centralized platform for operations and emissions data, agile decision making is nearly impossible.
The lack of a single source of truth results in version control problems as well, such as when multiple copies of the same spreadsheet are created and manipulated by different teams.
Calculate and reconcile emissions
Additionally, we often hear from emissions teams that they need help reconciling emissions data. This reconciliation requires resolving information from different types of potentially conflicting measurement or operational data. Generally, reconciliation means understanding the reasons why estimates or measurements of emissions in the same spatial or temporal dimension are different, and then applying that finding to improve protocols. Effective reconciliation requires not just combining disparate data into a single repository but a detailed understanding of the models behind various measurements, developing analytics to quantify the uncertainty around various measurements, and effectively visualizing error bounds. These sophisticated workflows require built-for-purpose software.
Mobile access and collaborative workflows
As energy companies scale their efforts, the limitations of do-it-yourself solutions become more of a risk. Not only are teams left to ingest more and more data, but workflows become more and more sophisticated. An emissions data solution needs not only to handle sophisticated analytics around measurement reconciliation, but it also needs to be accessible and intuitive for field personnel making measurements on-site.
Reduce risk with an MRV SaaS solution.
Legacy tools are increasingly risky and unreliable for keeping track of operations and emissions reduction efforts as they scale. The key is to leverage MRV SaaS software that can help streamline processes and automate data ingestion from all disparate sources, helping you save time, reduce risk, and ensure accuracy.
At Validere, our MRV technology is backed by a team of world-class experts with a deep understanding of measurement science, helping break down silos between teams and ensure that all data sources are connected and validated.
Utilizing a MRV solution also ensures that your data is reliable and completely auditable, providing confidence in reporting, decision making, and dispute resolution. Overall, teams that utilize this technology benefit from:
- Access to real-time data, enabling faster, evidence-based decision making
- Ability to quantify risk of missing or incorrect measurement data
- A single source of truth that provides clarity on operational issues & paths to remediation
- More confidence in your data when dealing with regulators, certifying bodies, and partners
Level up oil & gas operations & emissions data with Validere.
Validere’s MRV technology and team of experts are here to help your teams solve today’s unique operational and environmental challenges. Enhance your approach with a single source of truth for all of your operations and emissions data.
Get in touch with our experts to learn more about how Validere’s MRV software and team of experts can help reduce the risk of spreadsheets.


