.png)
Previously we discussed the fact that two facilities, sitting side by side, could have identical paper emissions, while one may be a tightened up facility and the other pumps methane into the air. The actual emissions can be incredibly different. That’s why the key to reducing actual methane is measurement.
Yet we often hear the question: Why spend resources on measurement when those resources could be deployed on reductions?
Assuredly, that is a fair question. However, that question begs another question: what is the basis for the reduction strategy?
What should serve as the basis for emission reduction strategies?
Generally, when a company decides to pursue emissions reductions, the first data necessary to inform the plan is a breakdown of the sources of emissions. From there, the company will consider reduction projects on two principles. First, what are the projects with the largest opportunities for emissions reductions? Second, what is the cost effectiveness of the various options? These are essentially the questions behind marginal abatement cost curves.
The problem arises when the analysis is grounded in low quality emissions data.
A 2021 study published in Nature Communications from a team of researchers at Stanford documented the development of an inventory-based methane emissions model for the production segment, using data from component-level field study measurements calibrated with site-level field study data, essentially creating a measurement-informed inventory. They compared the results to the national greenhouse gas inventory (based on US EPA Subpart W calculations). The results were striking. In addition to deriving a different total emissions —by nearly a factor of two — the source attribution was markedly different.
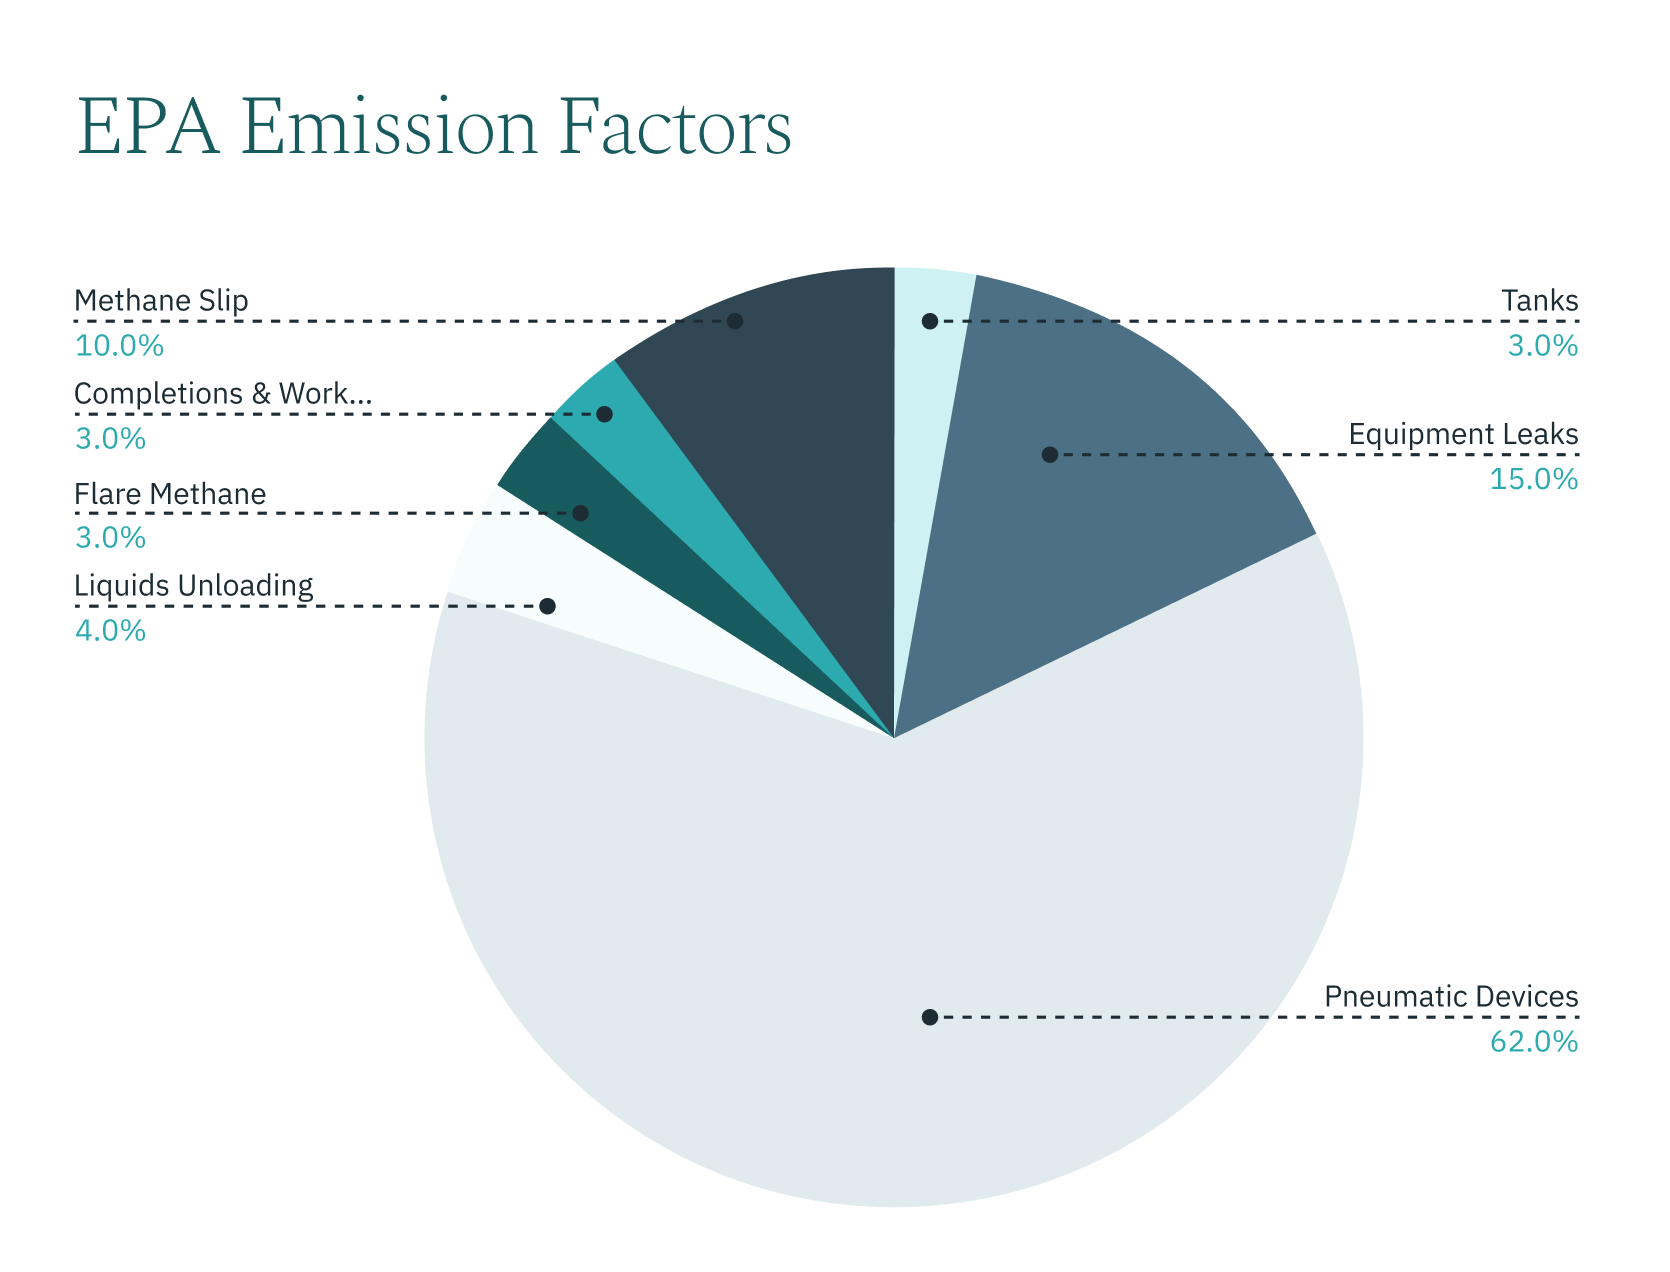
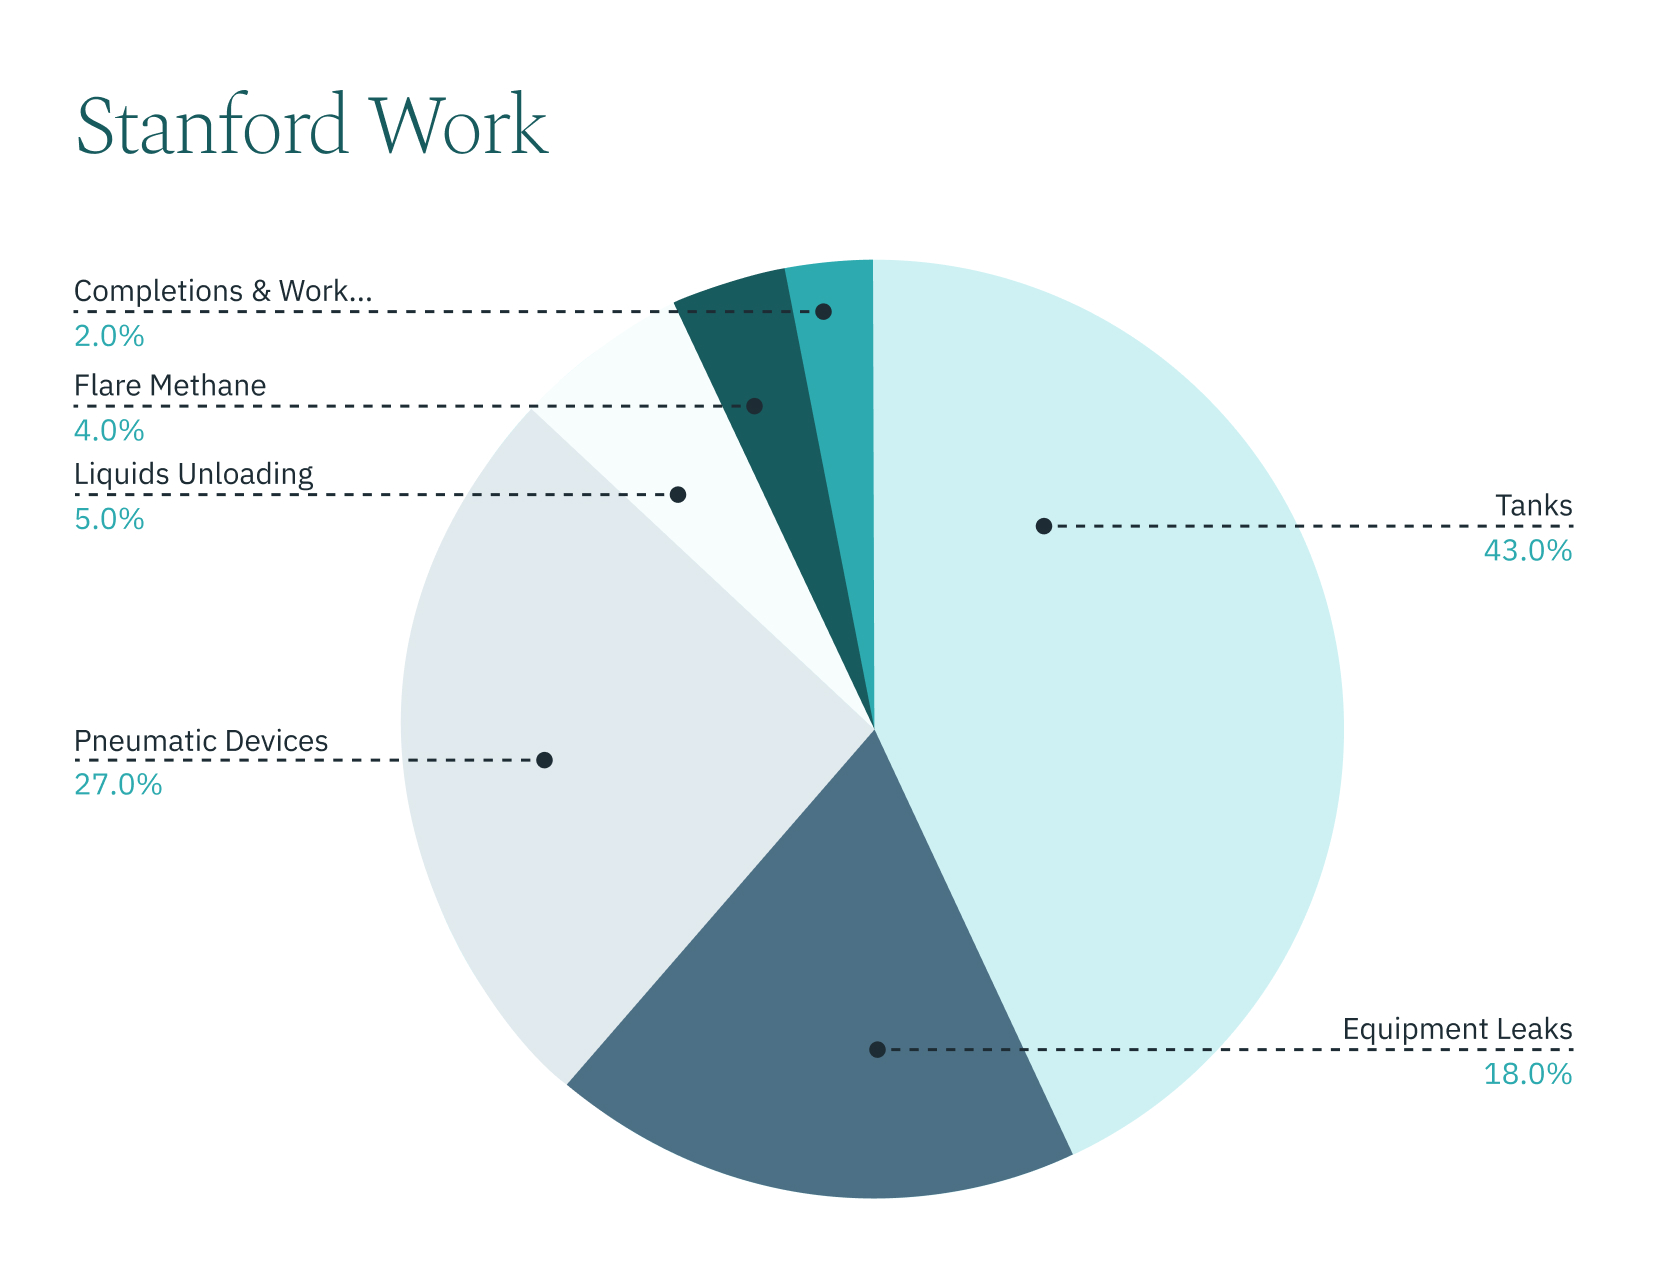
Source of methane emissions derived from a measurement-informed inventory varied significantly from the national greenhouse gas inventory from the US EPA Subpart W data.
An operator developing a reduction strategy based purely on EPA emission factors may conclude, as many have, that the most important source to eliminate (or reduce) is pneumatic devices. Next, the operator would focus on equipment leaks and methane slip. This operator would probably also swap out pneumatic pumps for solar powered chemical injection pumps, eliminate high bleed pneumatic controllers (or install expensive air compressors), and ramp up the number of facilities with a leak detection and repair program to beat down the equipment leaks category. And though they may feel a tad hopeless with respect to engine slip, they would conclude they were aggressively pursuing the sources that contributed 77% of the emissions.
According to the Stanford study, however, this company would only be targeting reductions in less than half of their methane emissions sources. Worse still, the company may conclude the tanks are not even material to their overall footprint and miss the opportunity to address low hanging fruit, such as thief hatch maintenance and improved operating practices generating nearly as much emissions as the pneumatic controllers and equipment leaks combined.
Clearly, effective deployment of capital to achieve reductions relies on good data to drive reduction opportunity selection. Generic, annual, average emission factors may be a fine way to compare industry segments or use in national policy decisions, but emission factors are a poor basis for abatement strategies.
For methane, there is a time to measure - then the time comes to reduce.
Interested in learning more about measurement and emissions reduction strategies? Contact us.