.png)
In order to understand the true impact of Appalachian natural gas pipelines on methane emissions, you need to see the full picture.
Environmental opposition challenges industry’s claims about the climate benefits of natural gas pipelines, pointing out that high methane emissions can undermine the CO2 emissions reductions from coal-to-gas displacement in power generation. Upstream oil and gas producers and midstream operators can improve public and political credibility and perception by harnessing both operational data and emissions management hardware to measure and manage methane emissions. Here’s what you need to know:
What is the methane emissions rate for Appalachian natural gas?
Studies estimate national natural gas value chain methane emissions rates as high as 2.3% of gross U.S. gas production, though with significant regional variation. A methane emissions rate that high would degrade the burner-tip emissions benefits of Appalachia-to-Southeast pipelines. Producers and midstream operators should harness both operational data and emissions management hardware to measure and manage methane emissions, to improve public and political credibility and perception of pipeline projects.
We believe that 2.3% emissions rate is very likely an overstatement of methane emissions for Appalachian gas. Our analysis of measurement-based studies of both national and Appalachian methane emissions suggests a full-value-chain methane emissions rate in the range of 1.4%. Omara and co-workers found the Appalachian methane emissions rate to be among the lowest in the country. Unlike producers in oil basins, who may face more challenging infrastructure development questions for associated gas volumes, dry-gas and even rich-gas producers — as in Appalachia — design midstream contracts to accommodate all available gas volumes.
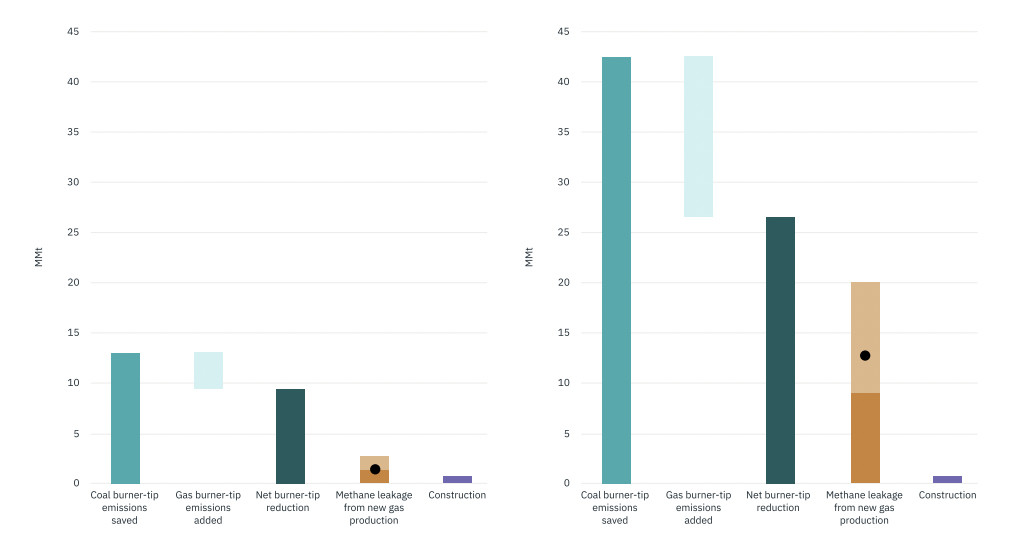
At a 1.4% methane emissions rate, and using the 20-year global warming potential to convert methane emissions to CO2-equivalent, Mountain Valley Pipeline (MVP) and Atlantic Coast Pipeline (ACP) would reduce annual CO2-equivalent emissions by 1.5 and 12 Mmt, respectively (see black dot in Figure 1 and Figure 2), although these figures increase sharply, to 2.5 and 20 Mmt, if methane emissions reach 2.3%, or fall to 1 and 9 Mmt of CO2e if full-value-chain emissions rates are are as low as 1% (see orange bars in Figure 1 and Figure 2).
These MVP emissions estimates will increase as downstream projects facilitate additional coal displacement, although CO2 emissions are likely to fall by a larger magnitude, meaning an improving impact on CO2e emissions.
Additionally, pipeline construction adds emissions and environmental disruption, but even for bigger projects, these emissions are typically modest, in the ~1 million ton of CO2e range (see purple bars in Figure 1 and Figure 2).
Figure 1 | CO2e impacts of MV Figure 2 | CO2e impacts of ACP
Sources | Validere analysis of EIA, CEMS, Genscape data, FERC filings
Understanding the net impact
At that 1.4% methane emissions rate and 20-year global-warming potential, we estimate that MVP and ACP would reduce CO2-equivalent emissions by ~8 and ~14 Mmt annually (see difference in black dot and dark green bars in Figure 1 and Figure 2), respectively, the equivalent of taking ~1.7 and ~3 million cars off the road.
Construction emissions do not significantly impact these findings. Even if construction emissions were 10 times as high as operators estimated in FERC filings, over a 10-year horizon, this would offset only ~10% of the CO2e emissions reductions from the new pipelines.
Over the next 20 years, completing MVP, as Democratic Sen. Joe Manchin’s original permitting reform bill strongly supported, would reduce U.S. CO2e emissions by ~150 million tons. Less likely but still possible, the bill could revive ACP, which would conservatively add an additional ~275 million tons of emissions reduction.
Measurement, reporting, and verification solutions for methane emissions reduction
With environmental opposition pointing to methane emissions as undermining the environmental benefits of coal-to-gas switching, credible emissions quantification and demonstrated reductions drive perception of industry and the prospects for future pipeline development and production growth. For more information connect with our team of professionals today.
1R. A. Alvarez, D. Zavala-Araiza, D. R. Lyon, D. T. Allen, Z. R. Barkley, A. R. Brandt, K. J. Davis, S. C. Herndon, D. J. Jacob, A. Karion, E. A. Kort, B. K. Lamb, T. Lauvaux, J. D. Maasakkers, A. J. Marchese, M. Omara, S. W. Pacala, J. Peischl, A. L. Robinson, P. B. Shepson, C. Sweeney, A. Townsend-Small, S. C. Wofsy, S. P. Hamburg, Assessment of methane emissions from the U.S. oil and gas supply chain. Science 361, 186–188 (2018).
2 Mark Omara, Naomi Zimmerman, Melissa R. Sullivan, Xiang Li, Aja Ellis, Rebecca Cesa, R. Subramanian, Albert A. Presto, and Allen L. Robinson Environmental Science & Technology 2018 52 (21), 12915-12925 DOI: 10.1021/acs.est.8b03535


